MRI of the Breast
Leonard Glassman and Marieke Hazewinkel
Publicationdate
This review is based on a presentation given by Leonard Glassman and adapted for the Radiology Assistant by Marieke Hazewinkel.
MRI is a powerful tool: it is able to detect cancer not visible on conventional imaging, it can be used as a problem-solving instrument, and it can be applied to screen high-risk patients.
Breast MRI is also better at monitoring the response to chemotherapy than other imaging modalities used today.
It can change the treatment plan in 15-30% of patients with breast cancer.
We will discuss the interpretation of breast MRI by looking at:
- The morphology of a lesion
- T1- and T2- characteristics
- Patterns and kinetics of mass- and non-mass enhancement
- Specific breast lesions
Introduction
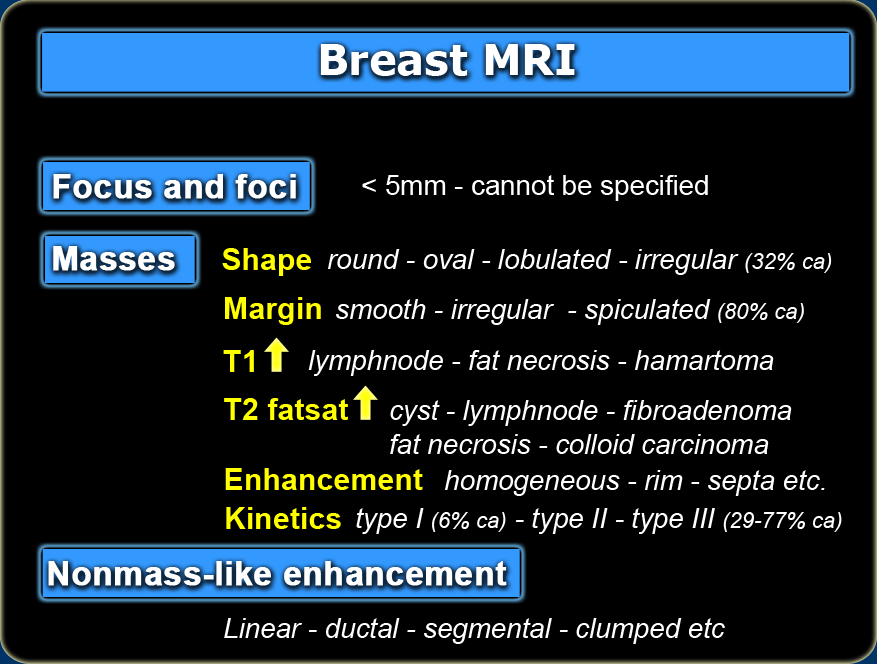
Enhancing lesions are divided into three main categories: focus/foci, masses, and areas of non-mass enhancement (1).
-
Focus (or when multiple, foci) is an area of enhancement measuring less than 5 mm in diameter which is too small to characterize.
- A mass is a three-dimensional lesion that occupies a space within the breast.
- Non-masslike enhancement are areas of enhancement without a detectable three-dimensional mass.
Just as in mammography and ultrasound, we look at its shape, its margins and its internal characteristics: this includes its T1- and T2-characteristics as well its enhancement pattern.
Features of non-mass enhancement include its distribution, its internal enhancement pattern, and whether the enhancement is symmetric or asymmetric.
Focus and foci
One of the things we run into are 'little bright objects'.
These foci are enhancing areas of less than 5mm in diameter and are too small to characterize.
They have persistent type 1 curves.
These lesions are typically stable on follow-up and are considered to be a part of the normal
background enhancement pattern in the breast.
Masses
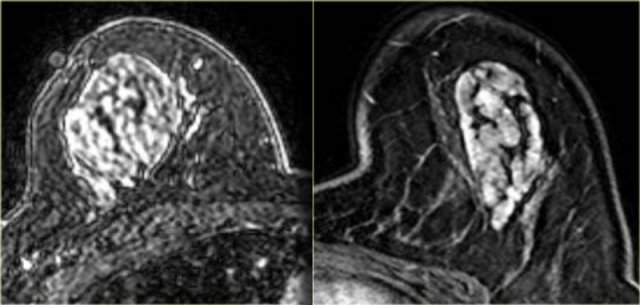
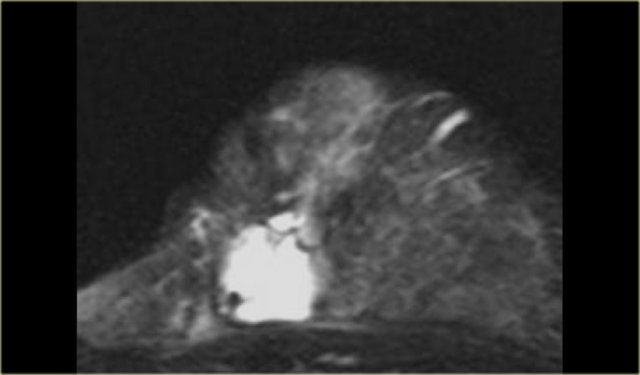
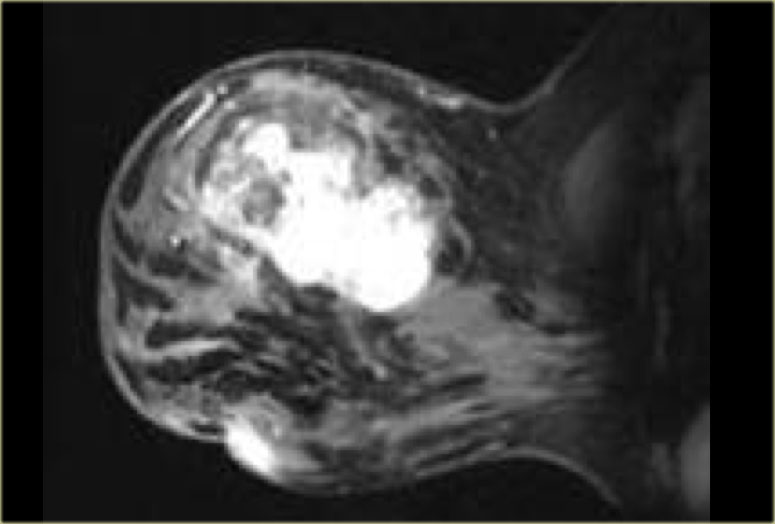 Enhancing mass with an irregular shape, which proved to be an angiosarcoma
Morphology
Shape
A mass can be round, oval, lobulated, or irregular.
Lobulated masses have undulating contours.
Irregular masses have an uneven shape that cannot be characterized as round, oval, or lobulated.
If a mass is irregularly shaped, it has a 32% chance of being malignant.
The image on the left shows a large, irregular mass, which proved to be an angiosarcoma.
The image on the far left is a juvenile fibroadenoma - it is oval in shape and has smooth margins, i.e. typically benign.
The non-enhancing septations are not seen in this case.
The image on the right is another example of a fibroadenoma: a lobulated mass with non-enhancing septations.
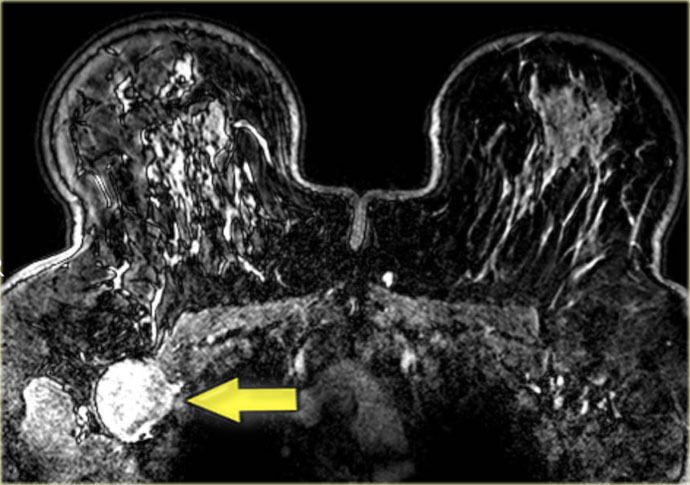
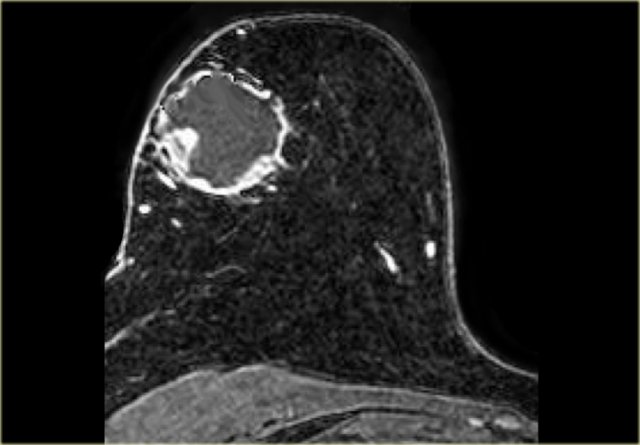
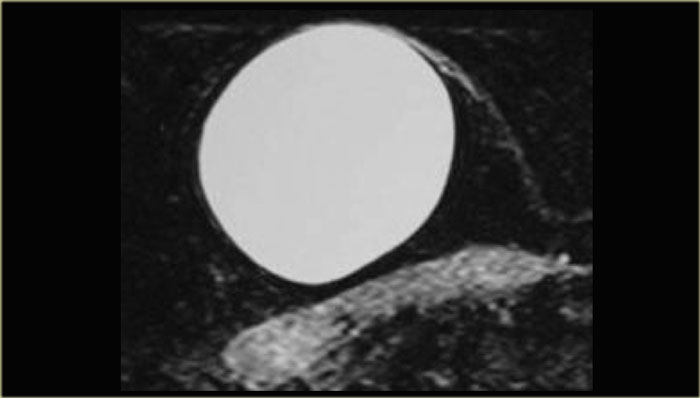 Epidermal inclusion cyst with smooth margins
Margin
Margins can be described as smooth, irregular, or spiculated .
Spiculated margins are frequently a feature of malignant breast lesions and radial
scars.
If a mass has spiculated margins, it has an 80% chance of being malignant.
On the left is an image showing a large, round mass with smooth margins, which turned out to be an epidermal inclusion cyst.
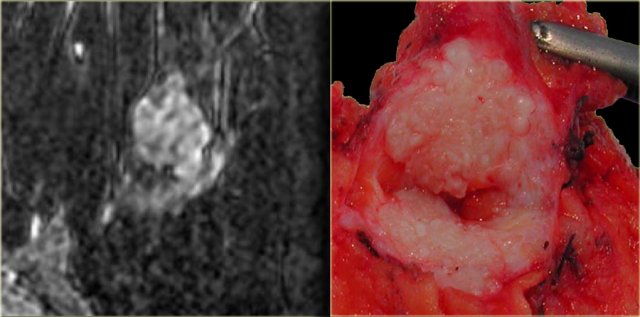
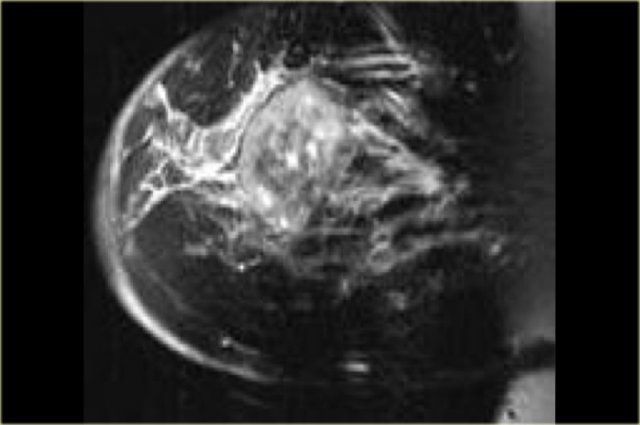
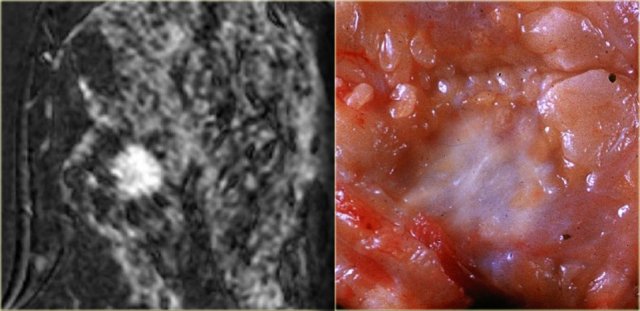 Invasive ductal carcinoma with spiculated margins
The image on the far left shows a spiculated mass, i.e. 80% chance of being malignant. .
Next to it the corresponding gross pathologic specimen.
You can see the spiculations invading the surrounding tissue in both.
Just like on mammography, this lesion is has a high likelihood of malignancy and would be labelled BIRADS 5.

The image on the far left shows an irregularly shaped mass with irregular margins, which was an invasive ductal carcinoma.
The image on the right shows a similarly irregularly shaped and irregularly marginated lesion, this time an adenoid cystic carcinoma.
 LEFT: Fibroadenoma with non-enhancing septations. RIGHT: Invasive carcinoma with enhancing septations
The image on the left is a classic benign fibroadenoma.
It is a lobulated mass with non-enhancing septations.
On this image the margins are a bit irregular here and there, which may be a reason to biopsy this lesion anyway.
The image on the right is a classic carcinoma.
It is an irregularly shaped mass with irregular margins and enhancing internal septations (the enhancement is not well seen on this image).
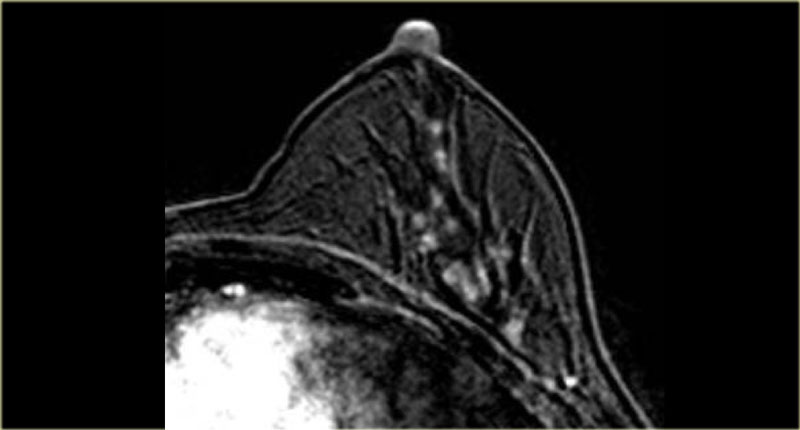
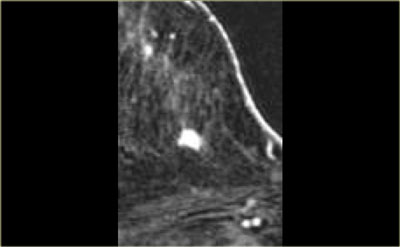
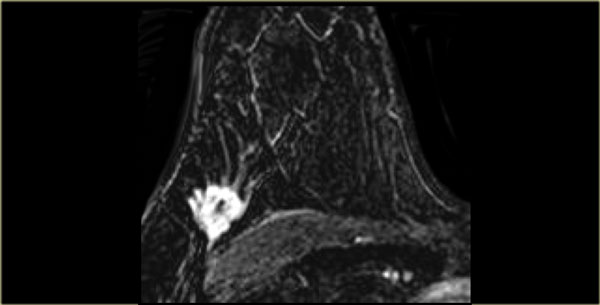
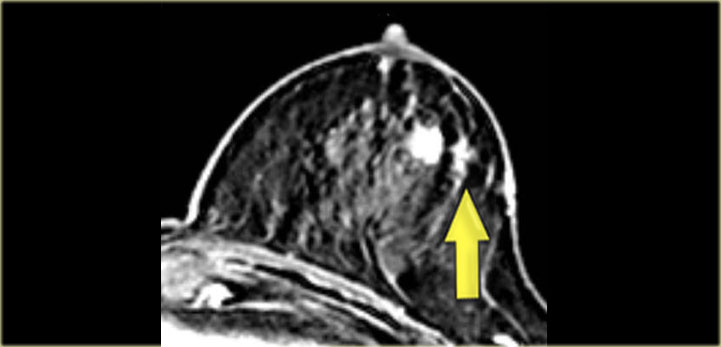
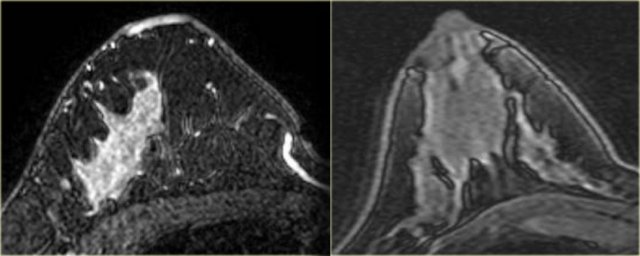
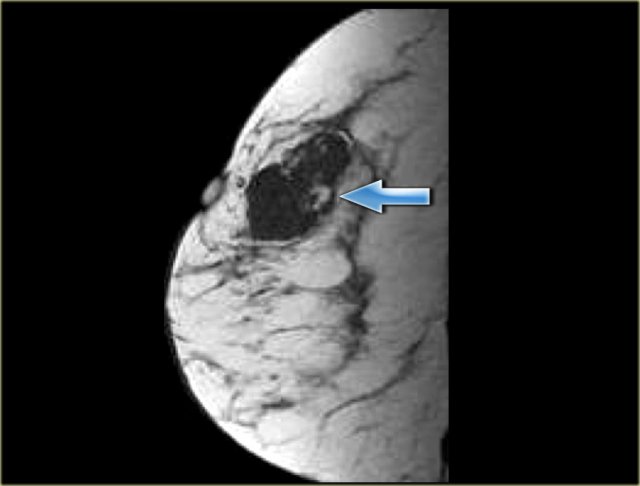 Fat-containing hamartoma with central high signal on T1WI (arrow)
T1-T2 characteristics
High signal on T1
The pre-contrast T1, non fat-suppressed sequence can show the presence of fat in a lesion.
Central high signal on a T1-weighted image can be seen in intramammary lymph nodes or fat necrosis.
Fat is also seen in hamartomas.
The image on the left shows an example of a fat-containing hamartoma in the breast.
Breast lesions containing fat are benign unless they are rapidly growing.
Rapidly growing lesions should be biopsied.
High signal on T2-fatsat
In T2 fat-suppressed images we are looking for water. Lesions that are bright on T2 include cysts, lymph nodes and fat necrosis.
These are all benign lesions.
Unfortunately there is one malignant lesion that has a high signal intensity on T2 fat-suppressed weighted images. This is the colloid carcinoma.
It is the exception to the rule that all things with bright signal on T2 fat-suppressed images are benign.
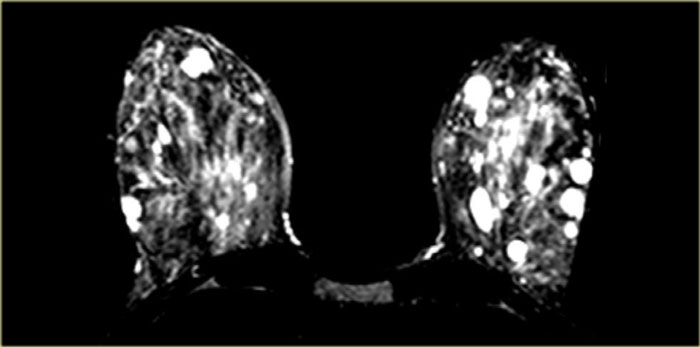
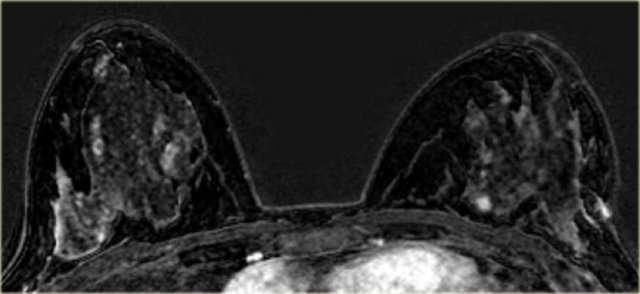
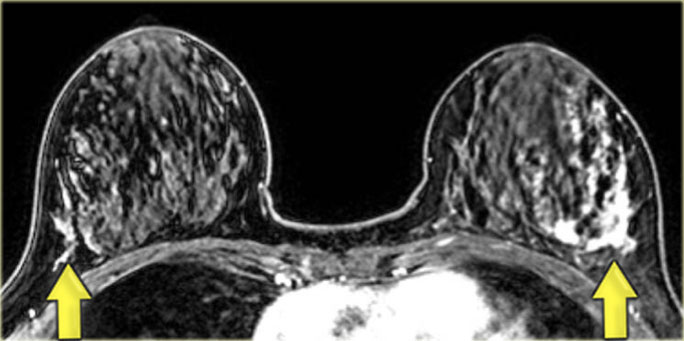
On the image on the left there are multiple rounded areas in both breasts.
These are multiple cysts.
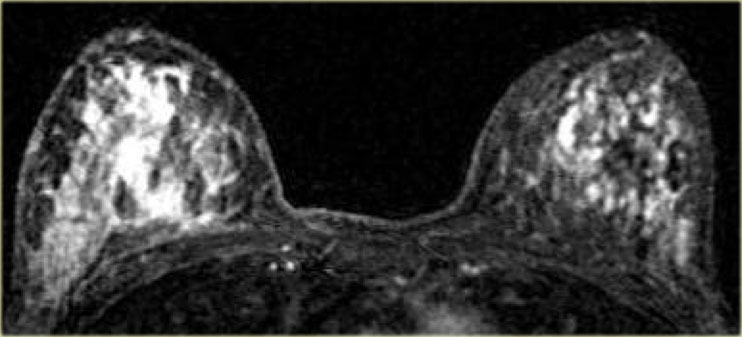
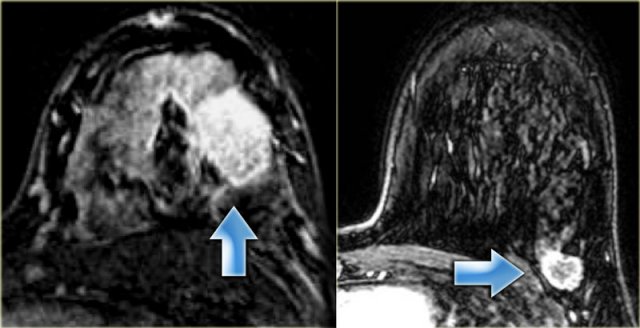
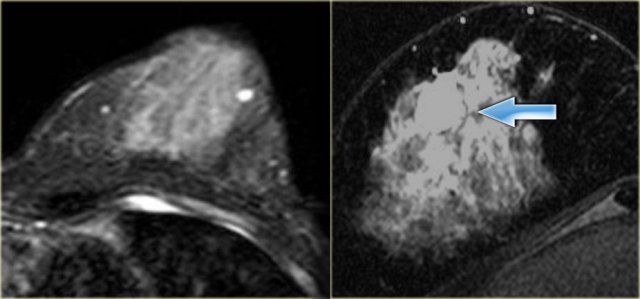 Fibroadenoma (left) and a colloid carcinoma (right). Both are bright on T2WI.
The image on the far left shows a round lesion with bright signal on T2.
This is a a fibroadenoma.
On the right is an example of a colloid carcinoma in a breast with dense, glandular tissue.
It is the exception to the rule that all things with bright signal on T2 fat-suppressed images are benign.
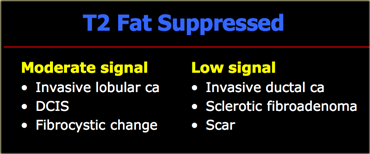
Moderate and low signal on T2-fatsat
The T2 fat-suppressed sequences are for detecting lesions with high signal, not moderate or low signal.
Moderate and low signal intensities can be caused by cancer.
Enhancement pattern of a mass
Mass enhancement occurs in six main patterns:
- Homogeneous enhancement is uniform and confluent enhancement throughout the mass.
- Heterogeneous enhancement is nonuniform enhancement, which varies within the mass.
- Rim enhancement is enhancement mainly concentrated at the periphery of the mass. This type of enhancement is frequently a feature of high-grade invasive ductal cancer, fat necrosis, and inflammatory cysts. A lesion with rim enhancement that is not a typical cyst has a 40% chance of malignancy.
- Dark internal septations refers to non-enhancing septations in an enhancing mass. These are typical for fibroadenomas, especially when the lesion has smooth or lobulated margins.
- Enhancing internal septations are usually a feature of malignancy.
- Central enhancement is pronounced enhancement of a nidus within an enhancing mass. Central enhancement has been associated with high-grade ductal cancer.
Homogeneous enhancement
The image on the left shows a homogeneously enhancing lesion.
This proved to be an invasive ductal carcinoma.
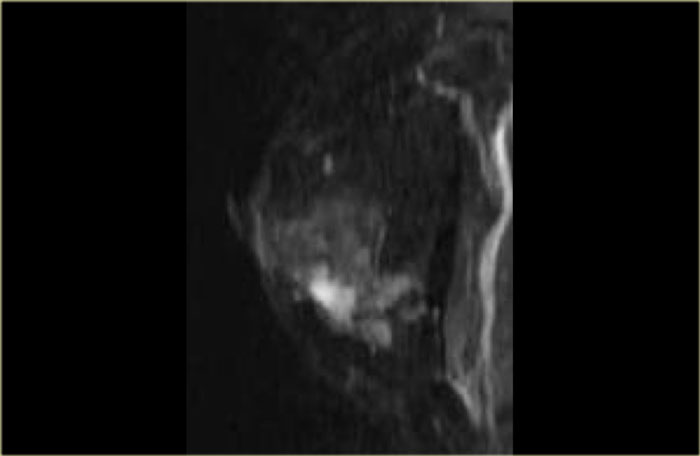
 Invasive lobular carcinoma with heterogenous enhancement
Heterogenous enhancement
On the left, the image shows an irregularly shaped mass with spiculations and a heterogeneous internal enhancement pattern, which proved to be an invasive lobular carcinoma.
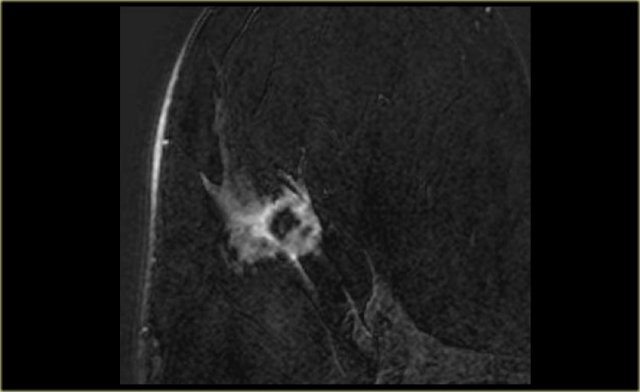 Invasive ductal carcinoma with rim enhancement
Rim enhancement
The image on the left shows rim enhancement of a lesion invading the surrounding tissue in a case of invasive ductal carcinoma.
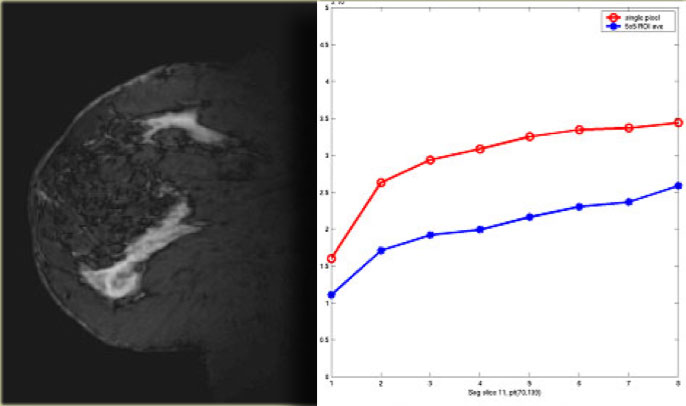 Type 1 curve with slow rise and a continued rise with tim
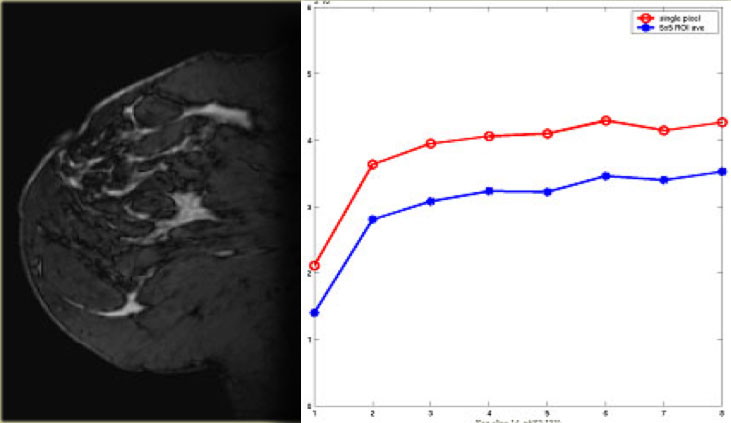
Temporal Resolution - Kinetic Analysis (Curves)
First we look at the initial upslope of the curve during the first one to two minutes.
This is either slow, medium or rapid.
Then there is the delayed portion - two minutes or more after the injection of contrast.
This part of the curve shows either an increase, plateau or washout.
The kinetic analysis takes about six minutes of repetitive scanning in total and can lead to three types of curve.
Type 1
On the image on the left is a type 1 curve.
There is a slow rise and a continued rise with time.
A lesion with a type 1 curve has a chance of 6% of being malignant.
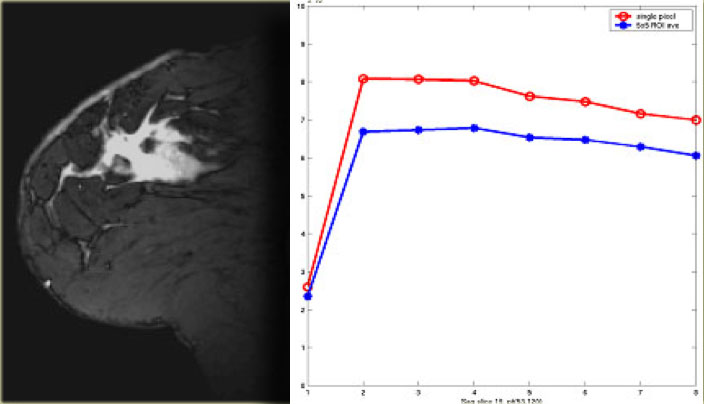 Type 3 curve with rapid initial rise, followed by washout in the delayed phase
Type 3
The type 3 curve shows a rapid initial rise, followed by a drop-off with time (washout) in the delayed phase.
A lesion with this type of curve is malignant in 29-77%.
This is the red on the CAD (Computer Aided Detection).
Type 2
Then there is the type 2 curve, which is in the middle: a slow or rapid initial rise
followed by a plateau in the delayed phase, which is allowed a variance of 10% up or down.
The chance of a lesion with a type 2 curve being malignant lies somewhere between
the 6% of the type 1 curve and the 29-77% of the type 3 curve.
Many physicians will biopsy lesions with type 2 curves.
For non-mass enhancement, kinetics are not very useful.
If there is clumped enhancement in a breast it must be biopsied, even though there are no areas with a type 3 curve.
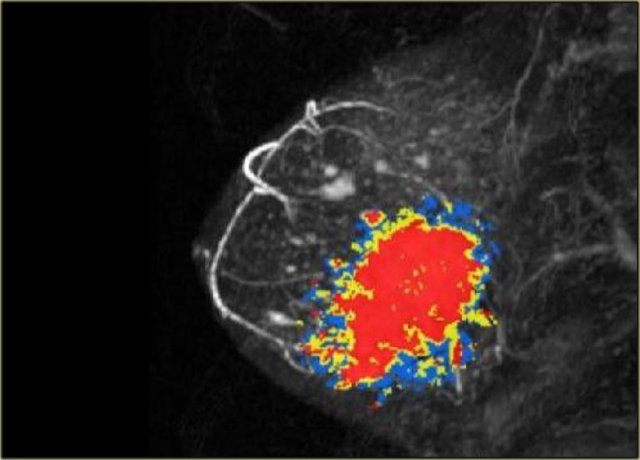 CAD with a large area of type 3 enhancement
CAD
Computer Aided Detection is a purely kinetic evaluation.
It does not evaluate the anatomy or pathology of the images.
CAD looks at the curves and peak enhancements for the contrast (automated kinetics).
It also has some very nice features, including motion registration during subtraction, which can correct for a patient's movement during the exam - something not all MRI scanners can do.
It can do multiplanar reconstruction and subtraction very well and very quickly – it also has a good measurement package.
The CAD shows a large area of red superimposed on the breast lesion
in the image on the left.
In CAD, red is bad: it means type 3 washout, and probably cancer.
The images on the left show a large, abnormally enhancing area in the left breast.
The CAD has detected some very small areas with type 3 washout (in red).
When you look at CAD images, take note of the worst (red) areas.
This was a large invasive ductal carcinoma.
Non-mass enhancement
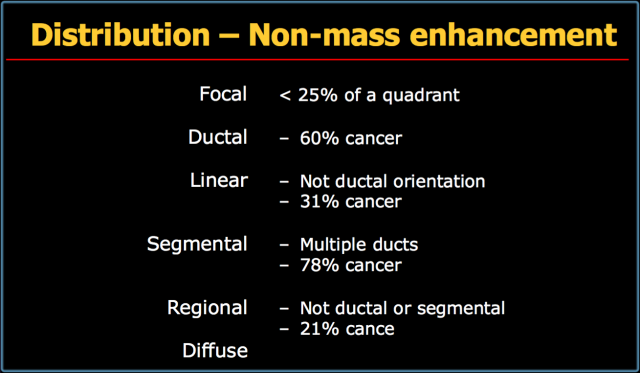
Distribution
Non-mass enhancement is enhancement without three-dimensional characteristics.
It is important because it occurs in a significant number of cancers.
You need to look at its distribution, its enhancement pattern and its symmetry or asymmetry.
The table on the left summarizes the terms used to describe the distribution of non-mass enhancement in the breast.
Focal refers to non-mass enhancement in less than 25% of a quadrant of the breast.
Ductal involvement is enhancement in a ductal distribution, and is cancer in 60% of cases.
Linear enhancement is similar to ductal enhancement, but does not have a ductal orientation.
This finding means cancer in 31% of cases.
Segmental enhancement refers to multiple ducts and has a 78% chance of being cancer.
Regional enhancement is not ductal or segmental but larger than focal and is cancer in 21%.
Diffuse non-mass enhancement is typically benign.
 Focal DCIS
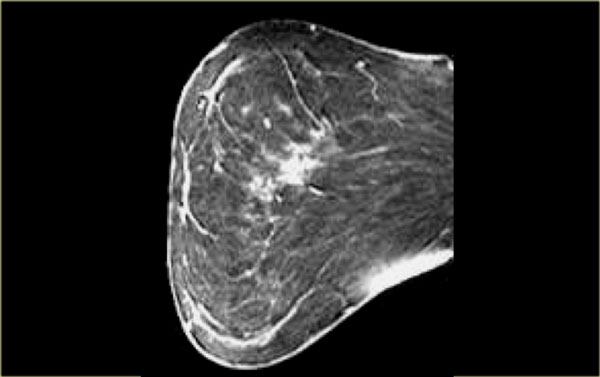
The image on the left shows focal non-mass enhancement.
This proved to be a focal DCIS.
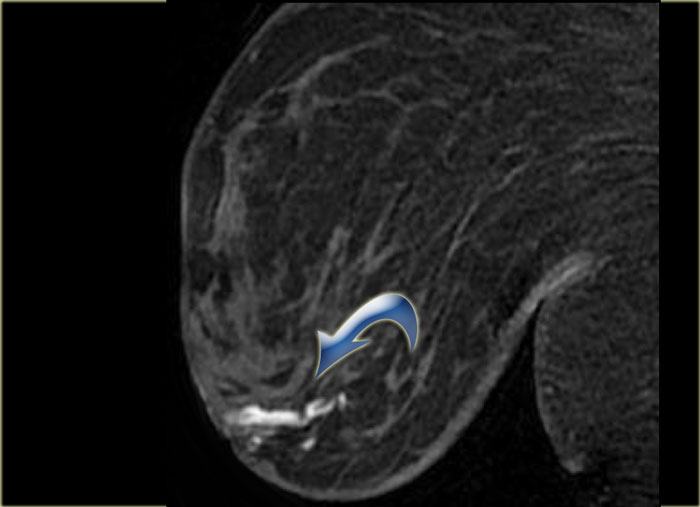
The image on the left shows linear non-mass enhancement.
This proved to be stromal fibrosis.
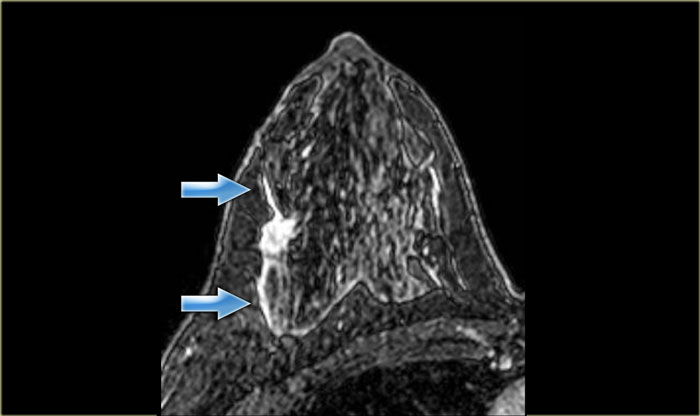
The image on the left shows a mass as well as areas of linear non-mass enhancement.
This proved to be linear DCIS with an invasive ductal carcinoma.
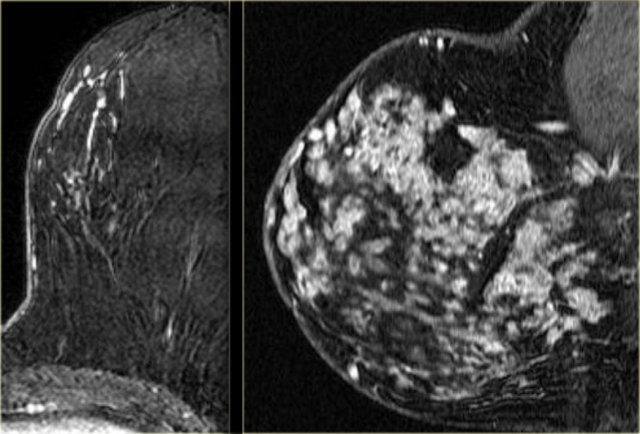 LEFT: segmental DCIS RIGHT: regional DCIS
On the left examples of segmental and regional non-mass enhancement in DCIS.
The image on the far left shows a mass with associated ductal enhancement coming from the mass,
which corresponds to anterior and posterior expansion of the tumor in this case of DCIS.
The image next to it shows an example of linear non-mass enhancement in a different orientation to that of the ducts in stromal fibrosis.
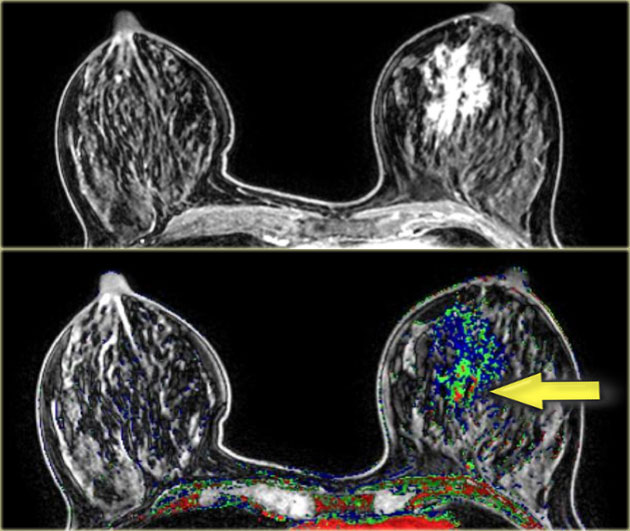
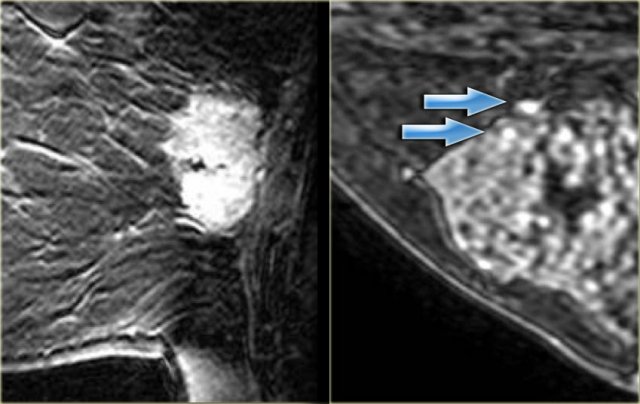 LEFT: Heterogeneous enhancement in invasive ductal carcinomaRIGHT: Punctate enhancement in a hamartoma with fibrocystic change (arrows)
Internal Enhancement Pattern - Nonmass
Non-mass enhancement can be termed homogeneous and heterogeneous, just as mass enhancement can.
As mentioned earlier, punctate enhancement is usually benign, but it can occur focally. In that case there is a 25% chance of cancer.
Clumped enhancement is the most important non-mass enhancing pattern to recognize. It has a 60% chance of cancer (typically DCIS).
For non-mass enhancement, kinetics are not very useful.
If there is clumped enhancement in a breast it must be biopsied, even if there are no areas with a type 3 curve.
On the far left heterogeneous enhancement in an invasive ductal carcinoma.
The image next to it shows punctate enhancement in a hamartoma with fibrocystic change (arrows).
 Clumped enhancement in DCIS
Clumped enhancement
Clumped enhancement is the most important non-mass enhancing pattern to recognize.
It has a 60% chance of cancer (typically DCIS).
On the left two examples of clumped enhancement in DCIS.
Associated findings
 Carcinoma with extensive thickening of the skin
Associated findings can be:
- Skin or nipple involvement
- Chest wall invasion
- Adenopathy
The image on the left shows a relatively small carcinoma in the right breast, with extensive thickening of the skin.
 Inflammatory carcinoma with thickening of the skin
The image on the left shows a large inflammatory carcinoma with diffuse thickening of the skin.
 Enhancing large lymph node (arrow) in a patient with breast cancer
The image on the left shows a large enhancing lymph node on the right.
Specific breast tumors
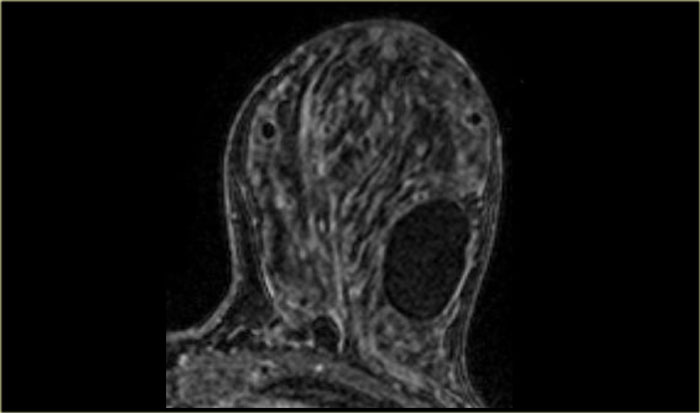
Cysts
Cysts have a high signal on T2 fat-suppressed images.
After the injection of gadolinium, they will show up as filling defects, sometimes with rim enhancement.
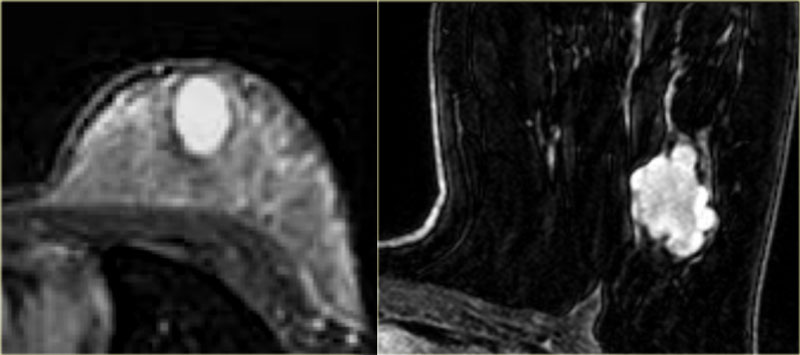
 Classic fibroadenoma
Fibroadenoma
Fibroadenomas are the most common benign breast lesions after cysts. In order to be certain a lesion is a fibroadenoma, certain criteria must be met:
- Benign morphologic characteristics
- Non-enhancing septations
- Type 1 curve
A fibroadenoma must have benign spatial characteristics.
This means it can not have a spiculated or microlobulated border.
On the left an example of a classic fibroadenoma: a round, smoothly marginated lesion
with some black or gray areas on the inside, which are the non-enhancing septations.
This lesion has a type 1 curve.
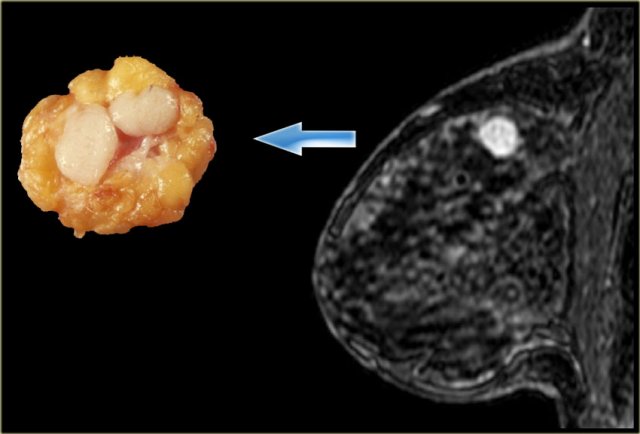
 Fibroadenoma with nonenhancing septations
On the far left is another example of a fibroadenoma with clear non-enhancing septations. These septations are also visible on the gross pathology.
 Two examples of a hamartoma with dark areas of fat on a fat suppressed T1WI with Gd.
Fat containing lesions
The pre-contrast T1, non fat-suppressed sequence can show the presence of fat in a lesion.
High signal on a T1-weighted image can be seen in intramammary lymph nodes, fat necrosis and hamartomas.
These areas will be dark on fat suppressed images.
On the left two classic examples of hamartomas.
These lesions have fat-containing areas which are suppressed on these images after the administration of intravenous gadolinium.
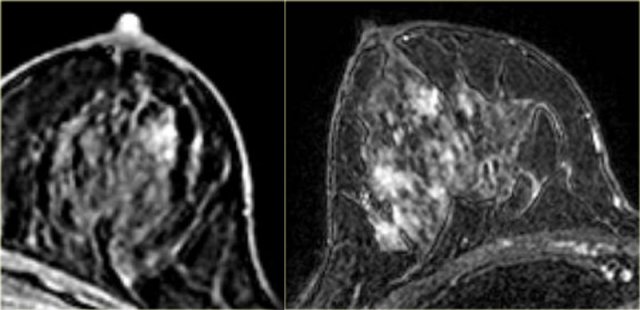
DCIS
Kinetics are usually not useful in DCIS, especially not in cases when low-grade.
Many cases of DCIS show no washout and usually there is slow initial enhancement.
The distribution of the enhancement however is important.
DCIS typically shows clumped, ductal, linear or segmental non-mass enhancement.
On the left a patient with areas of non-mass enhancement in both breasts (DCIS).
There is a small enhancing mass medially in the left breast, which was a small invasive carcinoma.
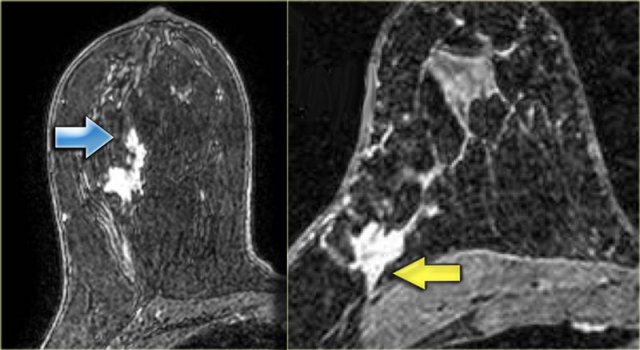
 DCIS and IDC
The image on the left shows an enhancing mass in the left breast.
This proved to be an invasive carcinoma.
Lateral to it is an area of ductal non-mass enhancement, which proved to be DCIS.
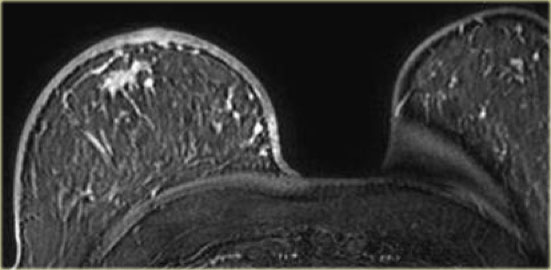
 DCIS bilaterally
On the left another case with diffuse, bilateral DCIS.
 DCIS bilaterally
Another case of DCIS, located laterally in both breasts.
The cases on the left are more difficult to diagnose .
Both of these patients had large homogeneously enhancing areas in the right breast.
In both patients this proved to be DCIS.
 Two cases of intraductal carcinomas
Invasive ductal carcinoma
Most invasive carcinoma are ductal, some are lobular, and there is a group of rarer types.
Regardless of the type of cancer, they typically appear on breast MRI as an irregularly shaped,
spiculated mass with rim- or heterogeneous enhancement after the administration of intravenous gadolinium.
On the left two cases.
The image on the far left is an invasive ductal carcinoma presenting as a large, heterogeneously enhancing mass.
Next to it an example of an invasive ductal carcinoma presenting as a smaller mass with rim-enhancement.
 Two cases of intraductal carcinomas
The image on the far left shows an irregular mass with some ductal extension, and
on the right an irregular mass extending to the chest wall, but not invading it.
There is no chest wall enhancement.
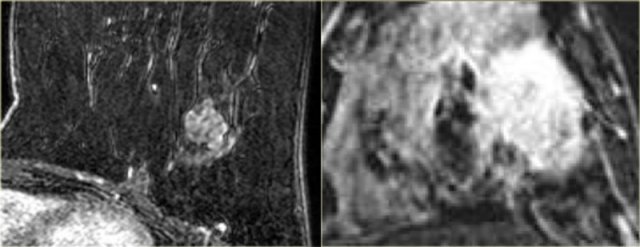
 Two cases of invasive lobular carcinoma
Invasive lobular carcinoma
Invasive lobular carcinoma is one of the types of cancer that does not always
show a lot of enhancement on breast MRI, which can make it difficult to diagnose.
In these two cases however, this was not a problem.
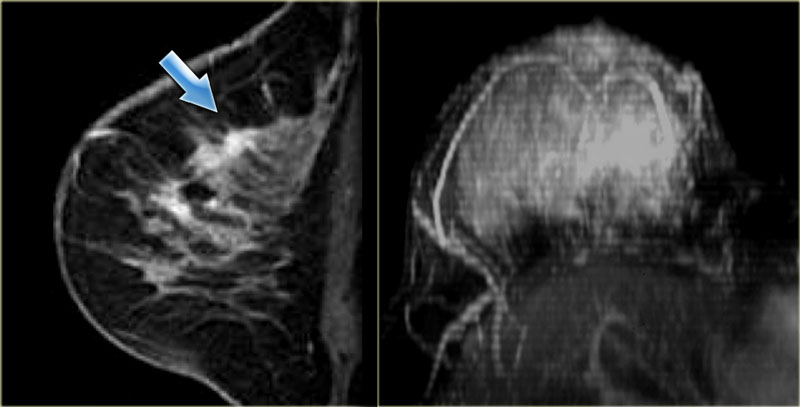
The image on the far left is of a diffuse invasive lobular carcinoma.
On the right is a MIP showing a large area of abnormal enhancement, which proved to be a diffuse invasive lobular carcinoma.
 Colloid carcinoma
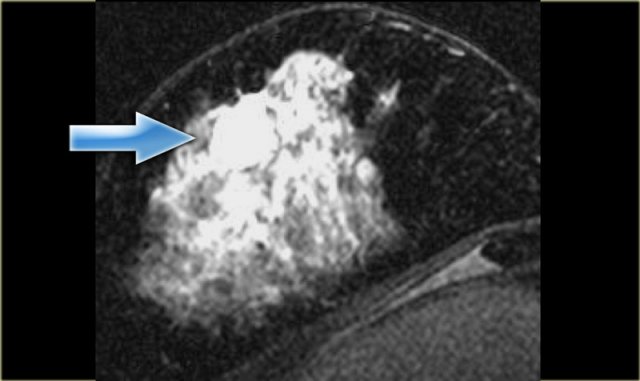
Colloid carcinoma
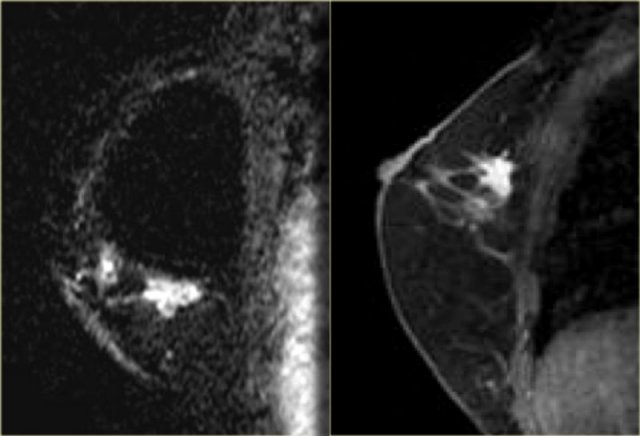
The image on the left is a T2WI with fat suppression.
It is a colloid carcinoma in a breast with dense, glandular tissue.
It is the exception to the rule that all things with bright signal on T2 fat-suppressed images are benign.
 Terminal duct carcinoma
Others
Terminal duct carcinoma
On the left a large, irregular, enhancing mass in a male patient.
This was a terminal duct carcinoma.
Terminal duct carcinoma
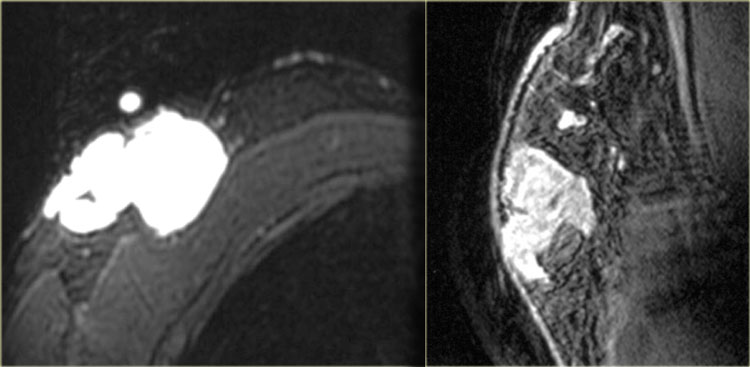
 Sarcoma with osseous differentiation
Sarcoma with osseous differentiation
The case on the left is a patient with a sarcoma with osseous differentiation, showing less enhancement.
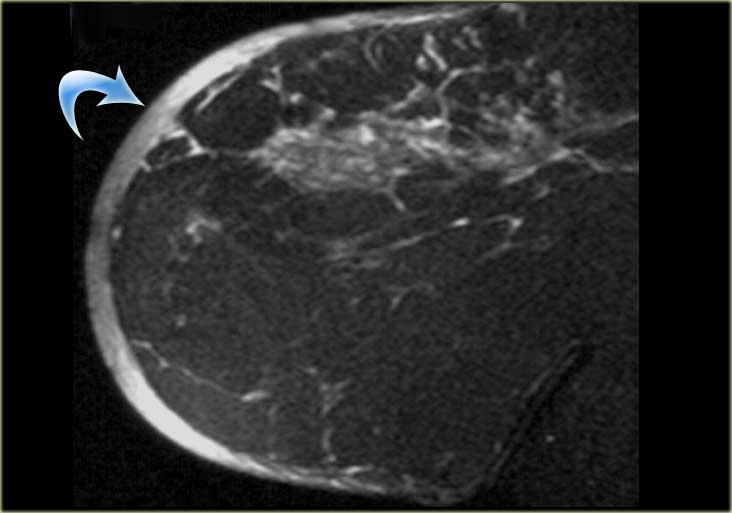
 Adenoid cystic carcinoma
Adenoid cystic carcinoma
On the left an image of an irregular enhancing mass which was an adenoid cystic carcinoma.
 Metaplastic carcinoma
Metaplastic carcinoma
On the left an example of a metaplastic carcinoma with rim-enhancement.
This is not necessarily a typical presentation.
There is a small area of stromal fibrosis laterally in the left breast.